Plot for Estimated Treatment Effect for SensIAT_fulldata_model Objects
Source: R/autoplot.R
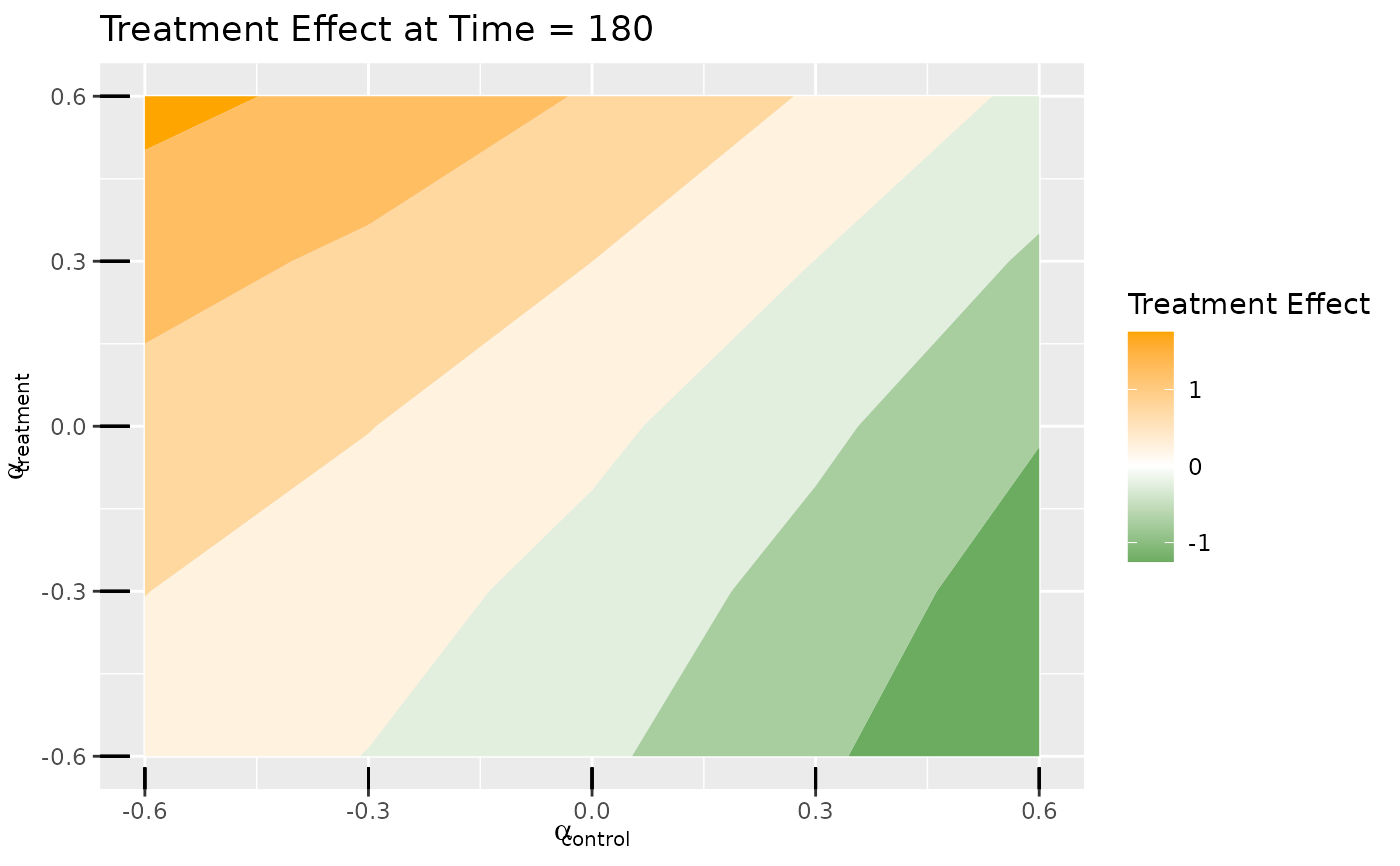
autoplot.SensIAT_fulldata_model.RdThe horizontal and vertical axes represent the sensitivity parameter alpha
for the control and treatment groups, respectively. The contour plot shows
the estimated treatment effect at each combination of alpha values.
Arguments
- object
A
SensIAT_fulldata_modelobject.- time
Time at which to plot the estimates.
- include.rugs
If
TRUE, adds rugs indicating the locations where the sensitivity was evaluated to the plot. IfFALSE, no rugs are added. IfNA, rugs are added only if the number of distinct values ofalpha_controlandalpha_treatmentis less than or equal to 10.- ...
Additional arguments passed to
predict.
Examples
# \donttest{
full.object <-
    fit_SensIAT_fulldata_model(
        data = SensIAT_example_fulldata,
        trt = Treatment_group == "treatment",
        outcome_modeler = fit_SensIAT_single_index_fixed_coef_model,
        id = Subject_ID,
        outcome = Outcome,
        time = Time,
        knots = c(60, 260, 460),
        alpha = c(-0.6, -0.3, 0, 0.3, 0.6)
    )
ggplot2::autoplot(full.object, time = 180)

# }
# }