
ModelMeaslesMixing creates a measles epidemiological model with mixing
between different population groups. The model includes vaccination,
quarantine, isolation, and contact tracing mechanisms.
Usage
ModelMeaslesMixing(
  n,
  prevalence,
  contact_matrix,
  vax_reduction_recovery_rate = 0.5,
  transmission_rate = 0.9,
  prop_vaccinated,
  vax_efficacy = 0.97,
  quarantine_period = 21,
  quarantine_willingness = 1,
  isolation_willingness = 1,
  isolation_period = 4,
  incubation_period = 12,
  prodromal_period = 4,
  rash_period = 3,
  hospitalization_rate = 0.2,
  hospitalization_period = 7,
  days_undetected = 2,
  contact_tracing_success_rate = 1,
  contact_tracing_days_window = 4,
  rash_reduction_contact_rate = 1
)
Arguments
- n
Number of individuals in the population.
- prevalence
Double. Initial proportion of individuals with the virus.
- contact_matrix
A numeric square matrix with the expected number of contacts per time step between population groups.
- vax_reduction_recovery_rate
Double. Vaccine reduction in recovery rate (default: 0.5).
- transmission_rate
Numeric scalar between 0 and 1. Probability of transmission (default: 0.9).
- prop_vaccinated
Double. Proportion of population that is vaccinated.
- vax_efficacy
Double. Vaccine efficacy rate (default: 0.99).
- quarantine_period
Integer. Number of days for quarantine (default: 21).
- quarantine_willingness
Double. Proportion of agents willing to quarantine (default: 1).
- isolation_willingness
Double. Proportion of agents willing to isolate (default: 1).
- isolation_period
Integer. Number of days for isolation (default: 4).
- incubation_period
Double. Duration of incubation period (default: 12).
- prodromal_period
Double. Duration of prodromal period (default: 4).
- rash_period
Double. Duration of rash period (default: 3).
- hospitalization_rate
Double. Rate of hospitalization (default: 0.2).
- hospitalization_period
Double. Period of hospitalization (default: 7).
- days_undetected
Double. Number of days an infection goes undetected (default: 2).
- contact_tracing_success_rate
Double. Probability of successful contact tracing (default: 1.0).
- contact_tracing_days_window
Integer. Number of days before rash onset that will be considered for contact tracing (default: 4).
- rash_reduction_contact_rate
Double. Reduction in contact rate during rash period (default: 1.0, full reduction). (see details)
Value
The
ModelMeaslesMixingfunction returns a model of classes epiworldR::epiworld_model and epiworld_measlesmixing.
Details
The contact_matrix is a square matrix of contact rates between entities.
Entry [i, j] gives the expected number of contacts that an agent in entity
i has with agents in entity j during a time step. The matrix should have
one row and one column per entity in the model.
The model includes three distinct phases of measles infection: incubation, prodromal, and rash periods. Vaccination provides protection against infection and may reduce recovery time.
The epiworldR::initial_states function allows the user to set the initial state of the model. In particular, the user can specify how many of the non-infected agents have been removed at the beginning of the simulation.
Contact Rate Reduction During Rash Period
The default behavior of the model is that agents in the rash period
are self-isolated. Nonetheless, since version 0.3.2-0, the user can
set the rash_reduction_contact_rate parameter to a value between 0 and 1 to
allow agents with Rash to still contact other agents, albeit at a reduced
rate. For example, if the user sets rash_reduction_contact_rate to 0.8,
agents in the rash period will have 20% of the contact rates specified in
the contact_matrix instead of 0%.
The basic reproduction number (R0) of the model can be computed as
$$ \mathcal{R}_0 = p_t c (D_p + (1-r_r) D_r) $$
Where \(p_t\) is the transmission_rate, \(c\) is the average number of
contacts per time step (given by the contact_matrix), \(D_p\) is
the duration of the prodromal period, \(D_r\) is the duration of the rash
period, and \(r_r\) is the rash_reduction_contact_rate. Therefore, when
calibrating the model, the effective infectious period should be considered
as the sum of the prodromal period and the rash period scaled by
(1 - rash_reduction_contact_rate).
Hospitalization Probability
Instead of hospitalization probability, the model uses hospitalization rate. The following equation describes the hospitalization probability as a function of the hospitalization rate and recovery rate (from rash):
$$ P(\text{hospitalization}) = \frac{ \text{hospitalization}_\text{rate}}{ \text{hospitalization}_\text{rate} + \text{recovery}_\text{rate} } $$
Where the \(\text{recovery}_\text{rate}\) is given by the rash period (1/duration of it). In other words, to match a desired hospitalization probability, the user needs to use the following:
h_rate <- p_hosp * (1/rash_days) / (1 - p_hosp)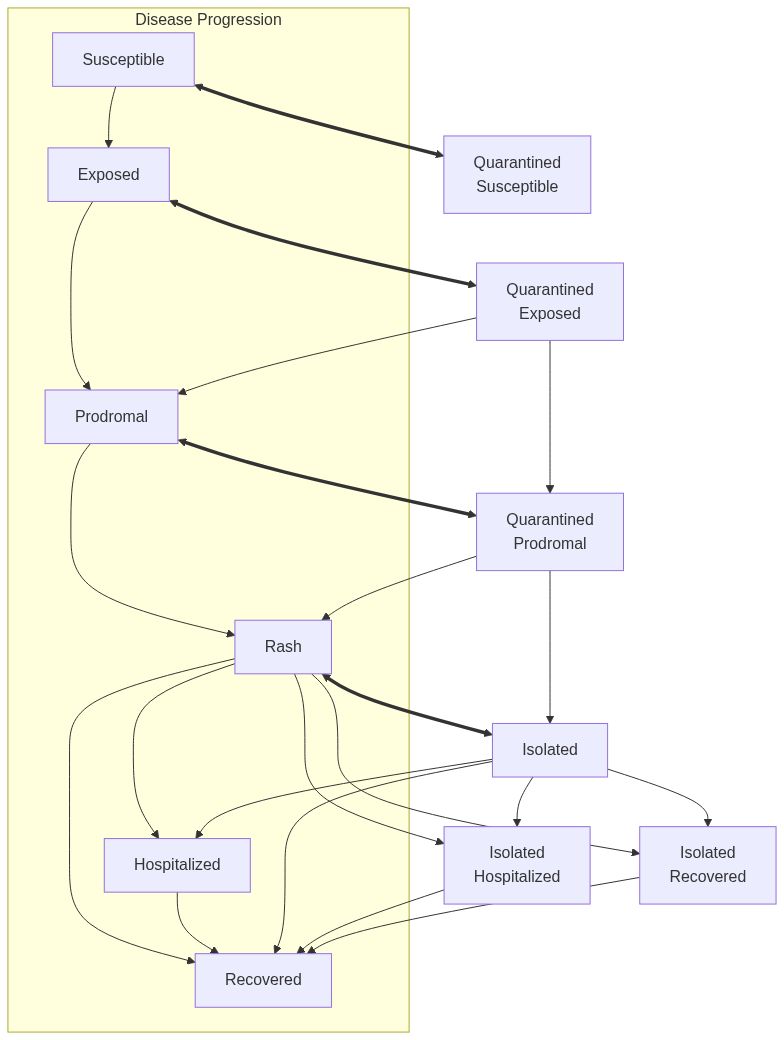
See also
epiworld-methods
Other Models:
ModelMeaslesMixingRiskQuarantine(),
ModelMeaslesSchool()
Other measles models:
ModelMeaslesMixingRiskQuarantine(),
ModelMeaslesSchool()
Examples
# Start off creating three entities.
# Individuals will be distributed randomly between the three.
e1 <- entity("Population 1", 3e3, as_proportion = FALSE)
e2 <- entity("Population 2", 3e3, as_proportion = FALSE)
e3 <- entity("Population 3", 3e3, as_proportion = FALSE)

# Contact matrix including within- and between-group contact rates
cmatrix <- (c(
  c(0.9, 0.05, 0.05),
  c(0.1, 0.8, 0.1),
  c(0.1, 0.2, 0.7)
) * 15) |> matrix(byrow = TRUE, nrow = 3)

N <- 9e3

measles_model <- ModelMeaslesMixing(
  n                        = N,
  prevalence               = 1 / N,
  transmission_rate        = 0.9,
  vax_efficacy             = 0.97,
  vax_reduction_recovery_rate = 0.8,
  incubation_period        = 10,
  prodromal_period         = 3,
  rash_period              = 7,
  contact_matrix           = cmatrix,
  hospitalization_rate     = 0.1,
  hospitalization_period   = 10,
  days_undetected          = 2,
  quarantine_period        = 14,
  quarantine_willingness   = 0.9,
  isolation_willingness    = 0.8,
  isolation_period         = 10,
  prop_vaccinated          = 0.95,
  contact_tracing_success_rate = 0.8,
  contact_tracing_days_window = 4
)

# Adding the entities to the model
measles_model |>
  add_entity(e1) |>
  add_entity(e2) |>
  add_entity(e3)

set.seed(331)
run(measles_model, ndays = 100)
#> _________________________________________________________________________
#> Running the model...
#> ||||||||||||||||||||||||||||||||||||||||||||||||||||||||||||||||||||||||| done.
summary(measles_model)
#> ________________________________________________________________________________
#> ________________________________________________________________________________
#> SIMULATION STUDY
#>
#> Name of the model   : Measles with Mixing and Quarantine
#> Population size     : 9000
#> Agents' data        : (none)
#> Number of entities  : 3
#> Days (duration)     : 100 (of 100)
#> Number of viruses   : 1
#> Last run elapsed t  : 22.00ms
#> Last run speed      : 40.74 million agents x day / second
#> Rewiring            : off
#> Last seed used      : 8019
#>
#> Global events:
#>  - Quarantine process (runs daily)
#>
#> Virus(es):
#>  - Measles
#>
#> Tool(s):
#>  - MMR
#>
#> Model parameters:
#>  - (IGNORED) Vax improved recovery : 0.8000
#>  - Contact tracing days window     : 4.0000
#>  - Contact tracing success rate    : 0.8000
#>  - Days undetected                 : 2.0000
#>  - Hospitalization period          : 10.0000
#>  - Hospitalization rate            : 0.1000
#>  - Incubation period               : 10.0000
#>  - Isolation period                : 10.0000
#>  - Isolation willingness           : 0.8000
#>  - Prodromal period                : 3.0000
#>  - Quarantine period               : 14.0000
#>  - Quarantine willingness          : 0.9000
#>  - Rash period                     : 7.0000
#>  - Rash reduction contact rate     : 1.0000
#>  - Transmission rate               : 0.9000
#>  - Vaccination rate                : 0.9500
#>  - Vax efficacy                    : 0.9700
#>
#> Distribution of the population at time 100:
#>   - ( 0) Susceptible             : 8999 -> 8998
#>   - ( 1) Latent                  :    1 -> 0
#>   - ( 2) Prodromal               :    0 -> 0
#>   - ( 3) Rash                    :    0 -> 0
#>   - ( 4) Isolated                :    0 -> 0
#>   - ( 5) Isolated Recovered      :    0 -> 1
#>   - ( 6) Quarantined Latent      :    0 -> 0
#>   - ( 7) Quarantined Susceptible :    0 -> 0
#>   - ( 8) Quarantined Prodromal   :    0 -> 0
#>   - ( 9) Quarantined Recovered   :    0 -> 0
#>   - (10) Hospitalized            :    0 -> 0
#>   - (11) Recovered               :    0 -> 1
#>
#> Transition Probabilities:
#>  - Susceptible              1.00  0.00     -     -     -     -     -     -     -     -     -     -
#>  - Latent                      -  0.60  0.20     -     -     -  0.20     -     -     -     -     -
#>  - Prodromal                   -     -     -  1.00     -     -     -     -     -     -     -     -
#>  - Rash                        -     -     -     -     -  1.00     -     -     -     -     -     -
#>  - Isolated                    -     -     -     -  0.83     -     -     -     -     -  0.17     -
#>  - Isolated Recovered          -     -     -     -     -  1.00     -     -     -     -     -     -
#>  - Quarantined Latent          -     -     -     -     -     -  0.67     -  0.33     -     -     -
#>  - Quarantined Susceptible     -     -     -     -     -     -     -     -     -     -     -     -
#>  - Quarantined Prodromal       -     -     -     -  1.00     -     -     -     -     -     -     -
#>  - Quarantined Recovered       -     -     -     -     -     -     -     -     -     -     -     -
#>  - Hospitalized                -     -     -     -     -     -     -     -     -     -  0.96  0.04
#>  - Recovered                   -     -     -     -     -     -     -     -     -     -     -  1.00
#>