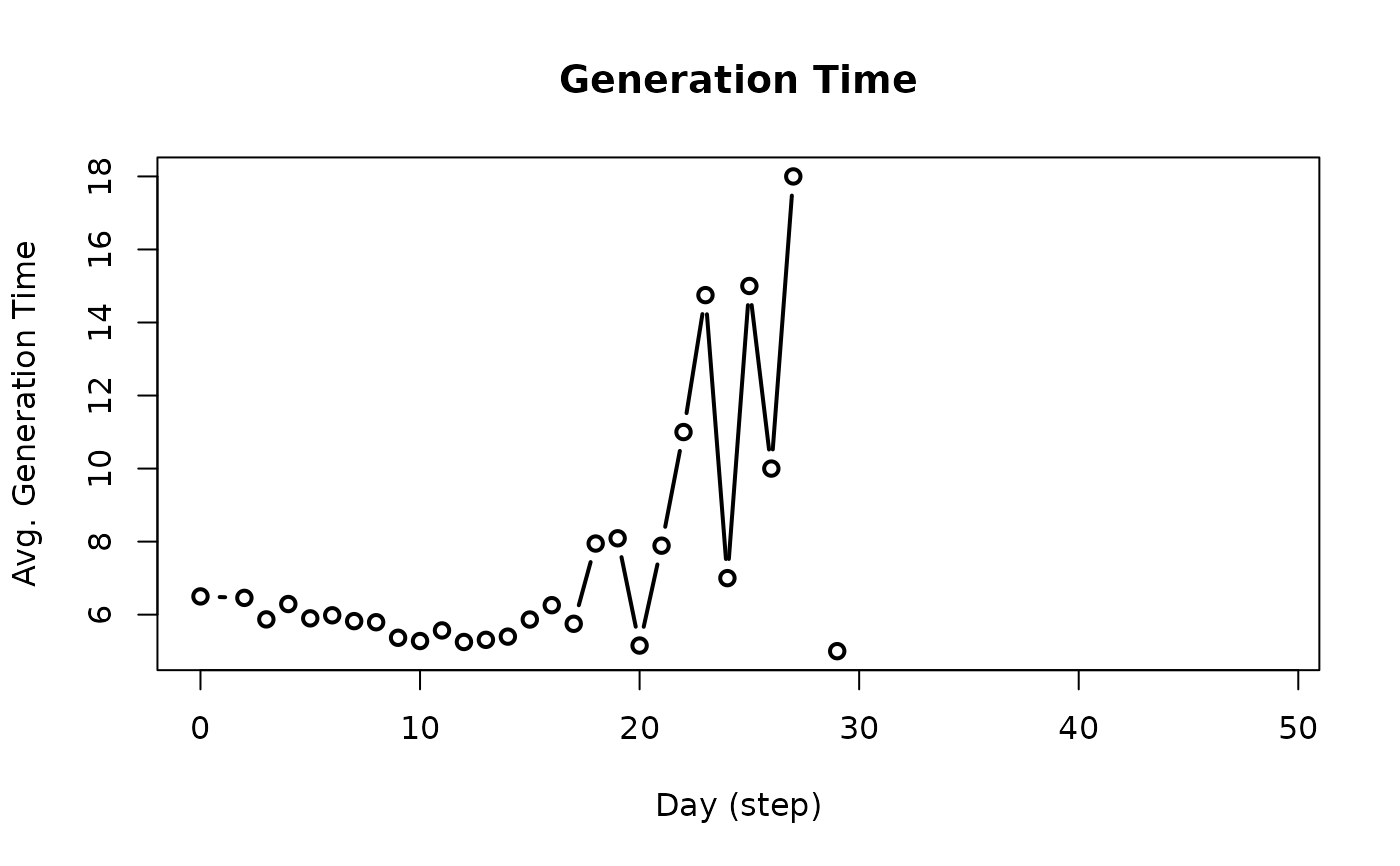
Extraction and plotting of generation time by virus over time.
Usage
get_generation_time(x)

# S3 method for class 'epiworld_generation_time'
plot(
  x,
  type = "b",
  xlab = "Day (step)",
  ylab = "Avg. Generation Time",
  main = "Generation Time",
  plot = TRUE,
  ...
)

plot_generation_time(x, ...)
Arguments
- x
An object of class
epiworld_sir,epiworld_seir, etc. (any model), or an object of class epiworld_generation_time.- ylab, xlab, main, type
Further parameters passed to
graphics::plot()- plot
Logical scalar. If
TRUE(default), the function will plot the desired statistic.- ...
In the case of plot methods, further arguments passed to graphics::plot.
Value
The function
get_generation_timereturns adata.framewith the following columns: "agent", "virus_id", "virus", "date", and "gentime".
The function
plot_generation_timeis a wrapper for plot and get_generation_time.
See also
Other Epidemiological metrics:
epiworld-repnum
Examples
# SEIR Connected model
seirconn <- ModelSEIRCONN(
  name              = "Disease",
  n                 = 10000,
  prevalence        = 0.1,
  contact_rate      = 2.0,
  transmission_rate = 0.8,
  incubation_days   = 7.0,
  recovery_rate     = 0.3
)

set.seed(937)
run(seirconn, 50)
#> _________________________________________________________________________
#> |Running the model...
#> |||||||||||||||||||||||||||||||||||||||||||||||||||||||||||||||||||||||| done.
#> |

# Get and plot generation time
gent <- plot_generation_time(seirconn)