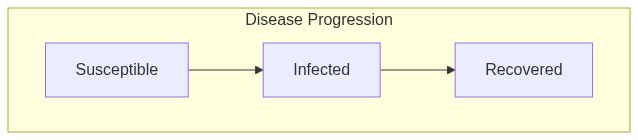
SIR model
Value
The
ModelSIRfunction returns a model of class epiworld_model.
Details
The initial_states function allows the user to set the initial state of the model. In particular, the user can specify how many of the non-infected agents have been removed at the beginning of the simulation.
See also
epiworld-methods
Other Models:
ModelDiffNet(),
ModelSEIR(),
ModelSEIRCONN(),
ModelSEIRD(),
ModelSEIRDCONN(),
ModelSEIRMixing(),
ModelSEIRMixingQuarantine(),
ModelSIRCONN(),
ModelSIRD(),
ModelSIRDCONN(),
ModelSIRLogit(),
ModelSIRMixing(),
ModelSIS(),
ModelSISD(),
ModelSURV()
Examples
model_sir <- ModelSIR(name = "COVID-19", prevalence = 0.01,
transmission_rate = 0.9, recovery_rate = 0.1)
# Adding a small world population
agents_smallworld(
model_sir,
n = 1000,
k = 5,
d = FALSE,
p = .01
)
# Running and printing
run(model_sir, ndays = 100, seed = 1912)
#> _________________________________________________________________________
#> Running the model...
#> ||||||||||||||||||||||||||||||||||||||||||||||||||||||||||||||||||||||||| done.
model_sir
#> ________________________________________________________________________________
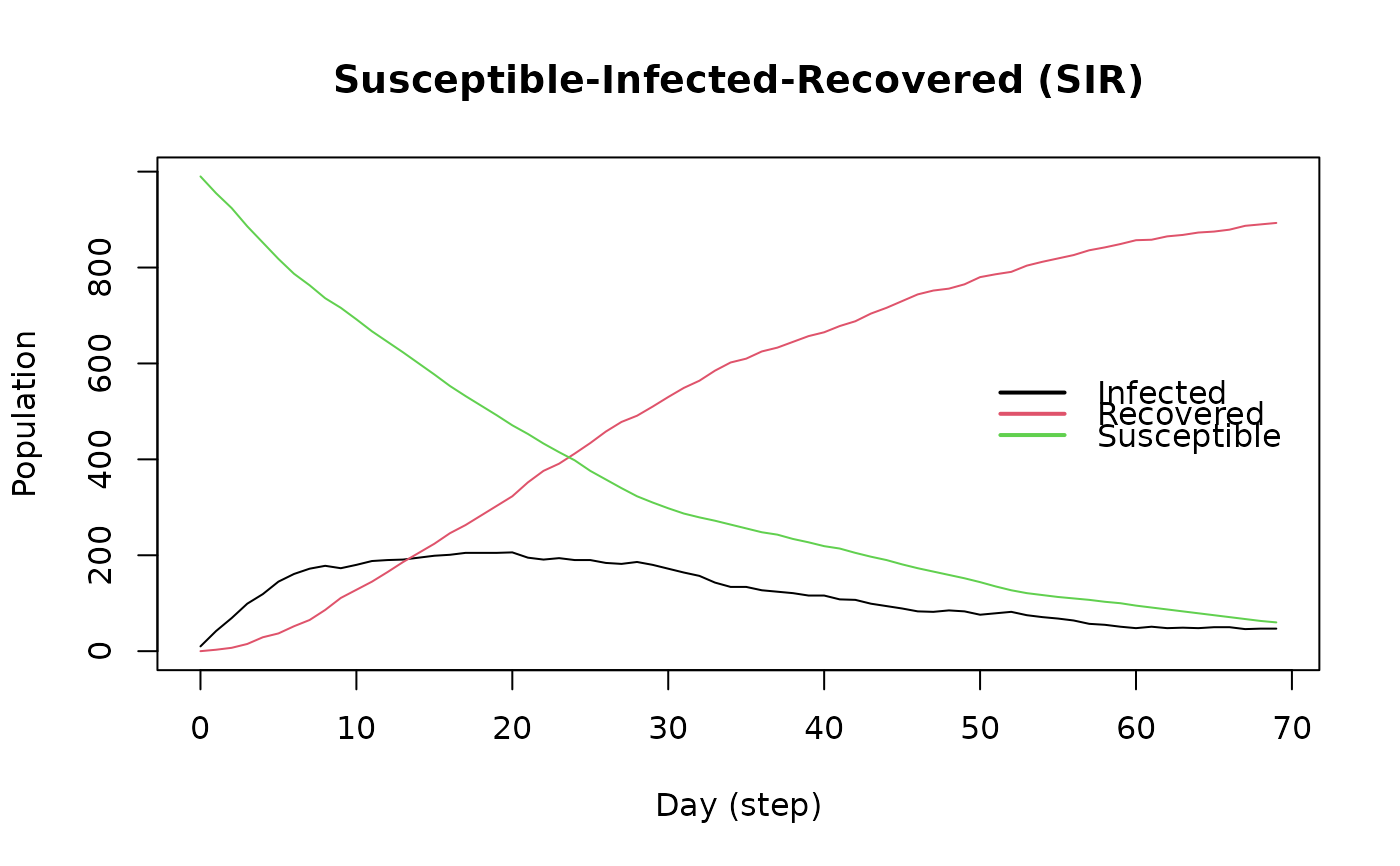
#> Susceptible-Infected-Recovered (SIR)
#> It features 1000 agents, 1 virus(es), and 0 tool(s).
#> The model has 3 states.
#> The final distribution is: 0 Susceptible, 0 Infected, and 1000 Recovered.
# Plotting
plot(model_sir)