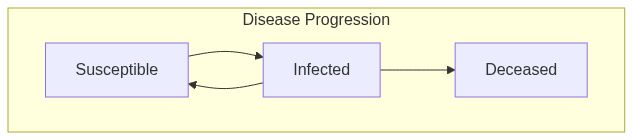
Susceptible-Infected-Susceptible-Deceased model (SISD) (wiki)
Arguments
- name
String. Name of the virus.
- prevalence
Double. Initial proportion of individuals with the virus.
- transmission_rate
Numeric scalar between 0 and 1. Virus's rate of infection.
- recovery_rate
Numeric scalar between 0 and 1. Rate of recovery from virus.
- death_rate
Numeric scalar between 0 and 1. Rate of death from virus.
Value
The
ModelSISDfunction returns a model of class epiworld_model.
See also
epiworld-methods
Other Models:
ModelDiffNet(),
ModelSEIR(),
ModelSEIRCONN(),
ModelSEIRD(),
ModelSEIRDCONN(),
ModelSEIRMixing(),
ModelSEIRMixingQuarantine(),
ModelSIR(),
ModelSIRCONN(),
ModelSIRD(),
ModelSIRDCONN(),
ModelSIRLogit(),
ModelSIRMixing(),
ModelSIS(),
ModelSURV()
Examples
model_sisd <- ModelSISD(
name = "COVID-19",
prevalence = 0.01,
transmission_rate = 0.9,
recovery_rate = 0.1,
death_rate = 0.01
)
# Adding a small world population
agents_smallworld(
model_sisd,
n = 1000,
k = 5,
d = FALSE,
p = .01
)
# Running and printing
run(model_sisd, ndays = 100, seed = 1912)
#> _________________________________________________________________________
#> Running the model...
#> ||||||||||||||||||||||||||||||||||||||||||||||||||||||||||||||||||||||||| done.
model_sisd
#> ________________________________________________________________________________
#> Susceptible-Infected-Susceptible-Deceased (SISD)
#> It features 1000 agents, 1 virus(es), and 0 tool(s).
#> The model has 3 states.
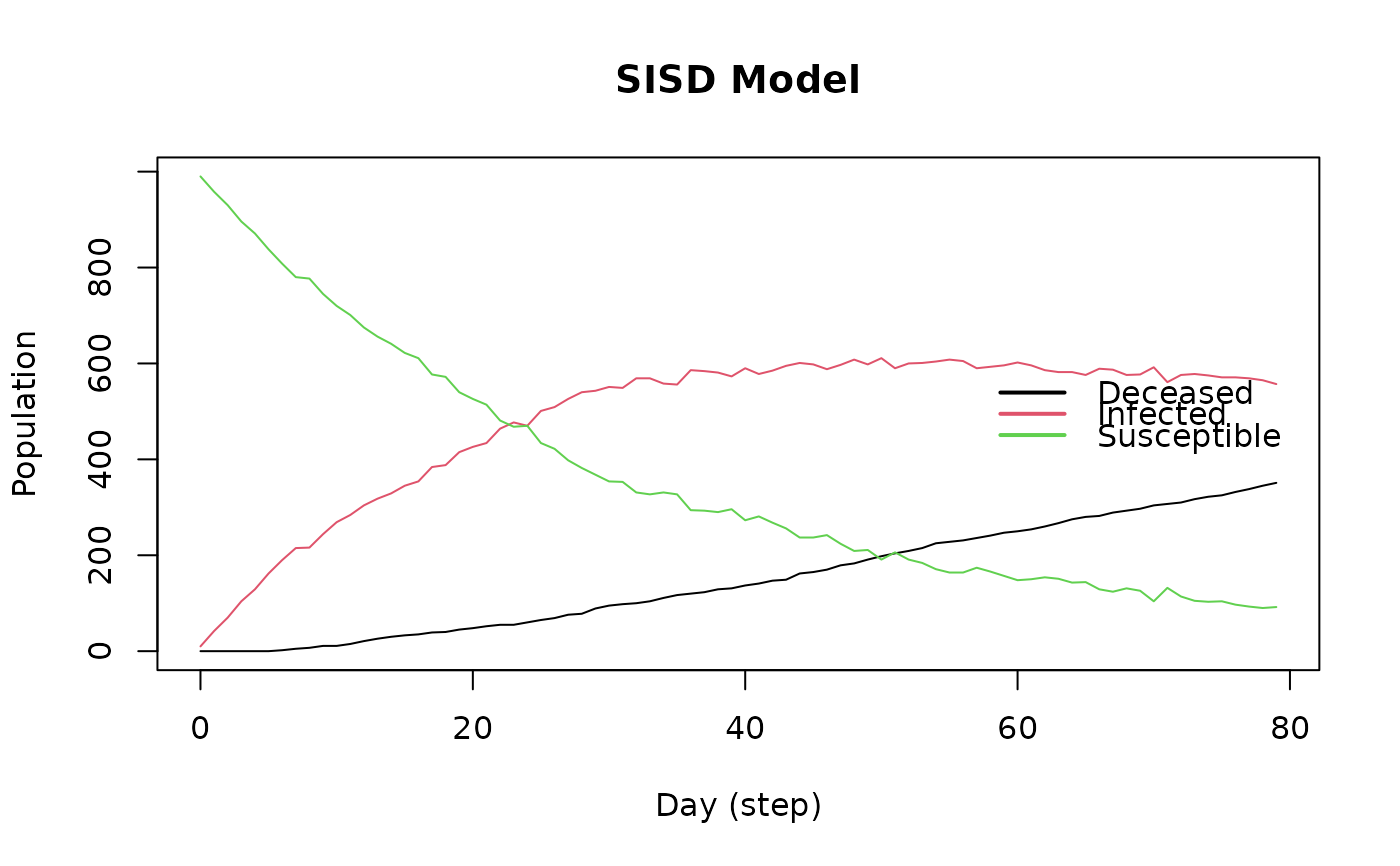
#> The final distribution is: 82 Susceptible, 427 Infected, and 491 Deceased.
# Plotting
plot(model_sisd, main = "SISD Model")