Functions to extract and visualize state transition counts, daily incidence, and conversion to array format.
Arguments
- x
An object of class
epiworld_sir,epiworld_seir, etc. (any model), or an object of class epiworld_hist_transition.- skip_zeros
Logical scalar. When
FALSEit will return all the entries in the transition matrix.- ...
In the case of plot methods, further arguments passed to graphics::plot.
- ylab, xlab, main, type
Further parameters passed to
graphics::plot()- plot
Logical scalar. If
TRUE(default), the function will plot the desired statistic.
Value
get_hist_transition_matrixreturns a data.frame with four columns: "state_from", "state_to", "date", and "counts."
The
as.arraymethod forepiworld_hist_transitionobjects turns thedata.framereturned byget_hist_transition_matrixinto an array ofnstates x nstates x (ndays + 1)entries, where the first entry is the initial state.
The
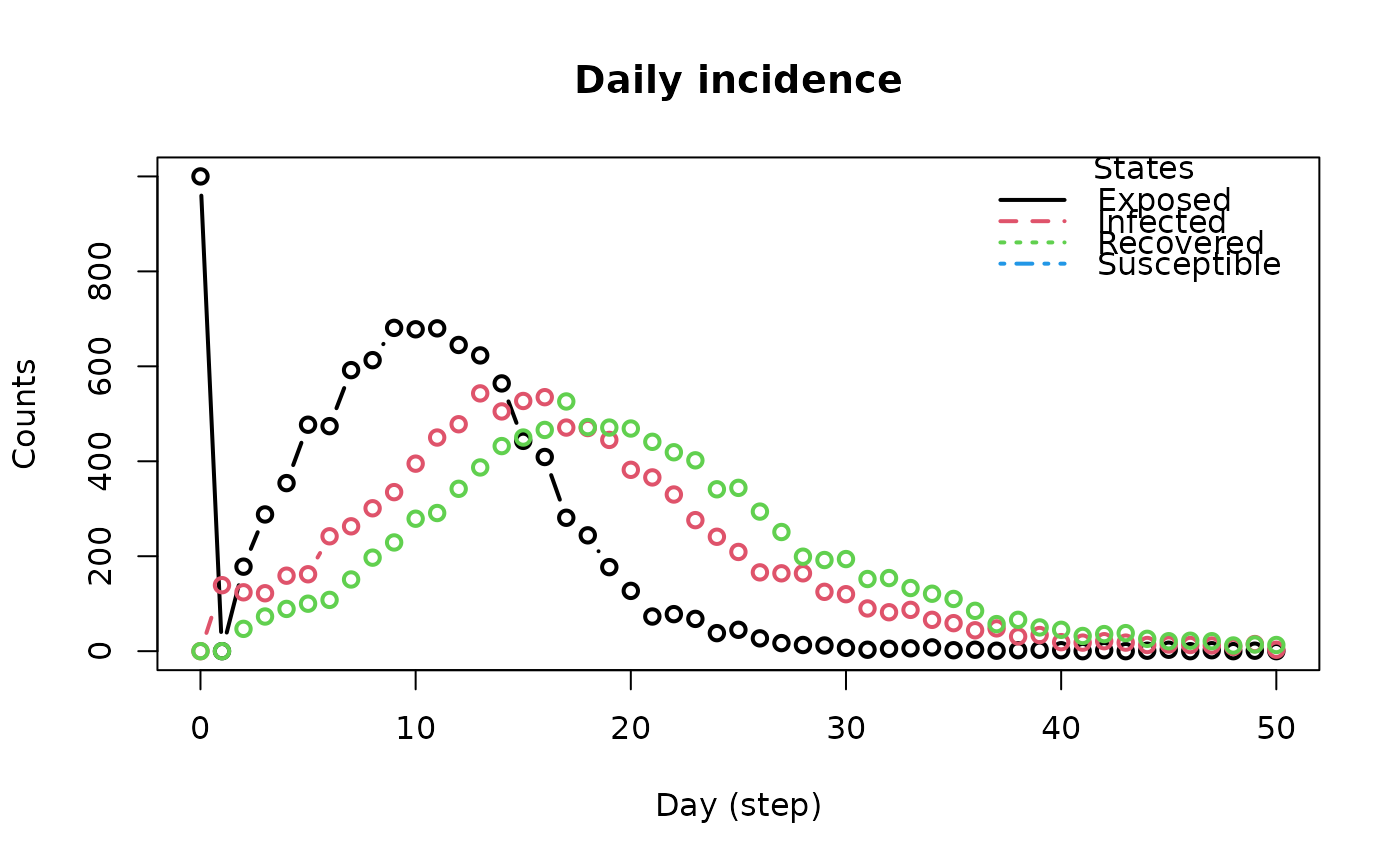
plot_incidencefunction returns a plot originating from the objectget_hist_transition_matrix.
The
plotmethod forepiworld_hist_transitionreturns a plot of the daily incidence.
Details
The plot_incidence function is a wrapper between
get_hist_transition_matrix and its plot method.
The plot method for the epiworld_hist_transition class plots the
daily incidence of each state. The function returns the data frame used for
plotting.
Examples
# SEIR Connected model
seirconn <- ModelSEIRCONN(
  name              = "Disease",
  n                 = 10000,
  prevalence        = 0.1,
  contact_rate      = 2.0,
  transmission_rate = 0.8,
  incubation_days   = 7.0,
  recovery_rate     = 0.3
)

set.seed(937)
run(seirconn, 50)
#> _________________________________________________________________________
#> |Running the model...
#> |||||||||||||||||||||||||||||||||||||||||||||||||||||||||||||||||||||||| done.
#> |

# Get the transition history
t_hist <- get_hist_transition_matrix(seirconn)
head(t_hist)
#>    state_from    state_to date counts
#> 1 Susceptible Susceptible    0   9000
#> 2     Exposed Susceptible    0      0
#> 3    Infected Susceptible    0      0
#> 4   Recovered Susceptible    0      0
#> 5 Susceptible     Exposed    0   1000
#> 6     Exposed     Exposed    0      0

# Convert to array
as.array(t_hist)[, , 1:3]
#> , , 0
#>
#>             Susceptible Exposed Infected Recovered
#> Susceptible        9000    1000        0         0
#> Exposed               0       0        0         0
#> Infected              0       0        0         0
#> Recovered             0       0        0         0
#>
#> , , 1
#>
#>             Susceptible Exposed Infected Recovered
#> Susceptible        9000       0        0         0
#> Exposed               0     845      155         0
#> Infected              0       0        0         0
#> Recovered             0       0        0         0
#>
#> , , 2
#>
#>             Susceptible Exposed Infected Recovered
#> Susceptible        8766     234        0         0
#> Exposed               0     724      121         0
#> Infected              0       0      103        52
#> Recovered             0       0        0         0
#>

# Plot incidence
inci <- plot_incidence(seirconn)