Plot epidemic curves
Details
If auto_trunc is set to TRUE, the function will automatically truncate
the plot based on the maximum date when the counts stop significantly
changing by state. The benchmark value for determining significant change
is set to 0.5% of the range of counts.
Examples
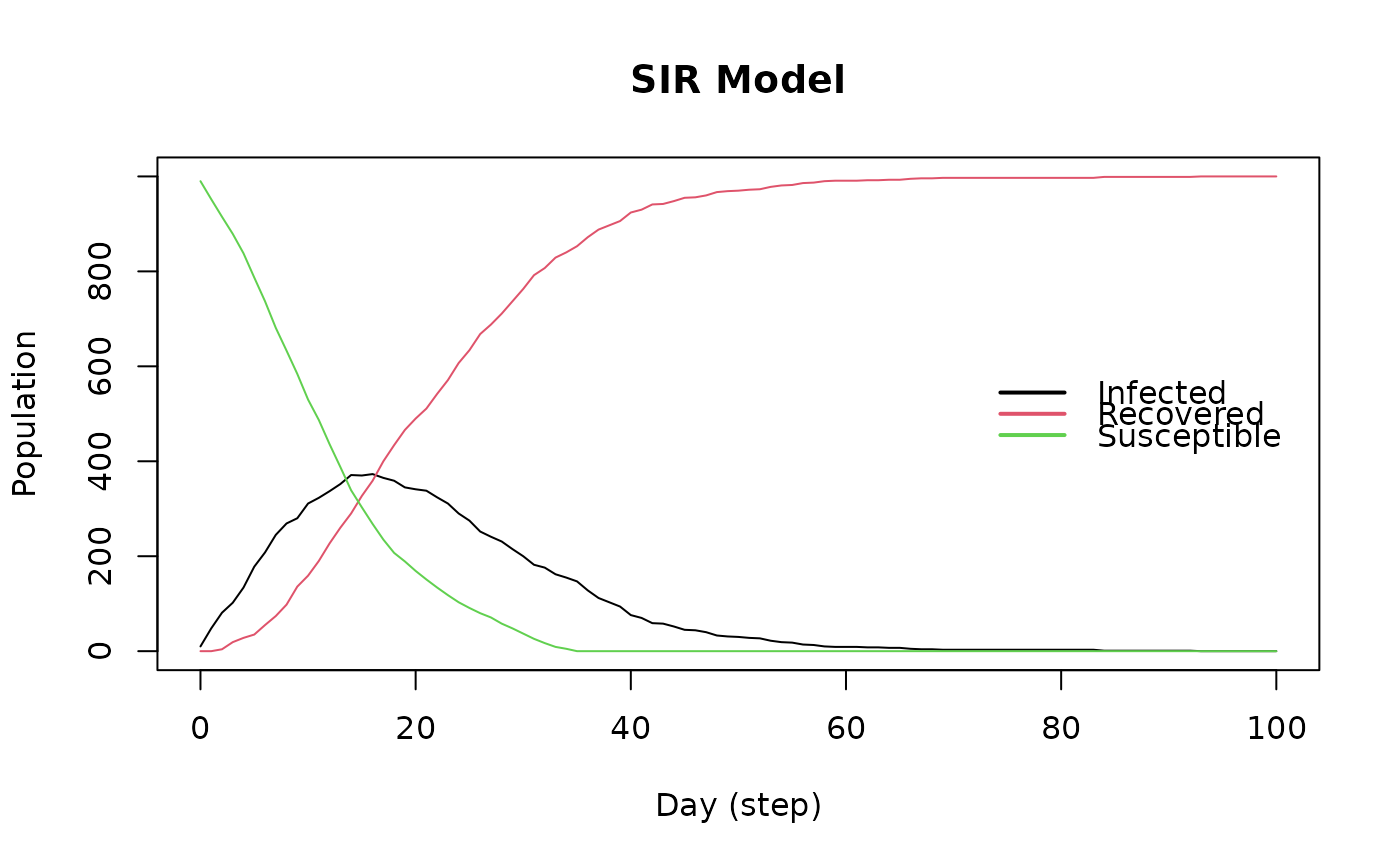
# Building and Initializing SEIR Model
sir <- ModelSIR(
  name = "COVID-19", prevalence = 0.01,
  transmission_rate = 0.9,
  recovery_rate = 0.1
)

# Adding a Small world population
agents_smallworld(
  sir,
  n = 1000,
  k = 5,
  d = FALSE,
  p = .01
)
# Running and printing
run(sir, ndays = 100, seed = 1912)
#> _________________________________________________________________________
#> Running the model...
#> ||||||||||||||||||||||||||||||||||||||||||||||||||||||||||||||||||||||||| done.
plot(sir, main = "SIR Model")