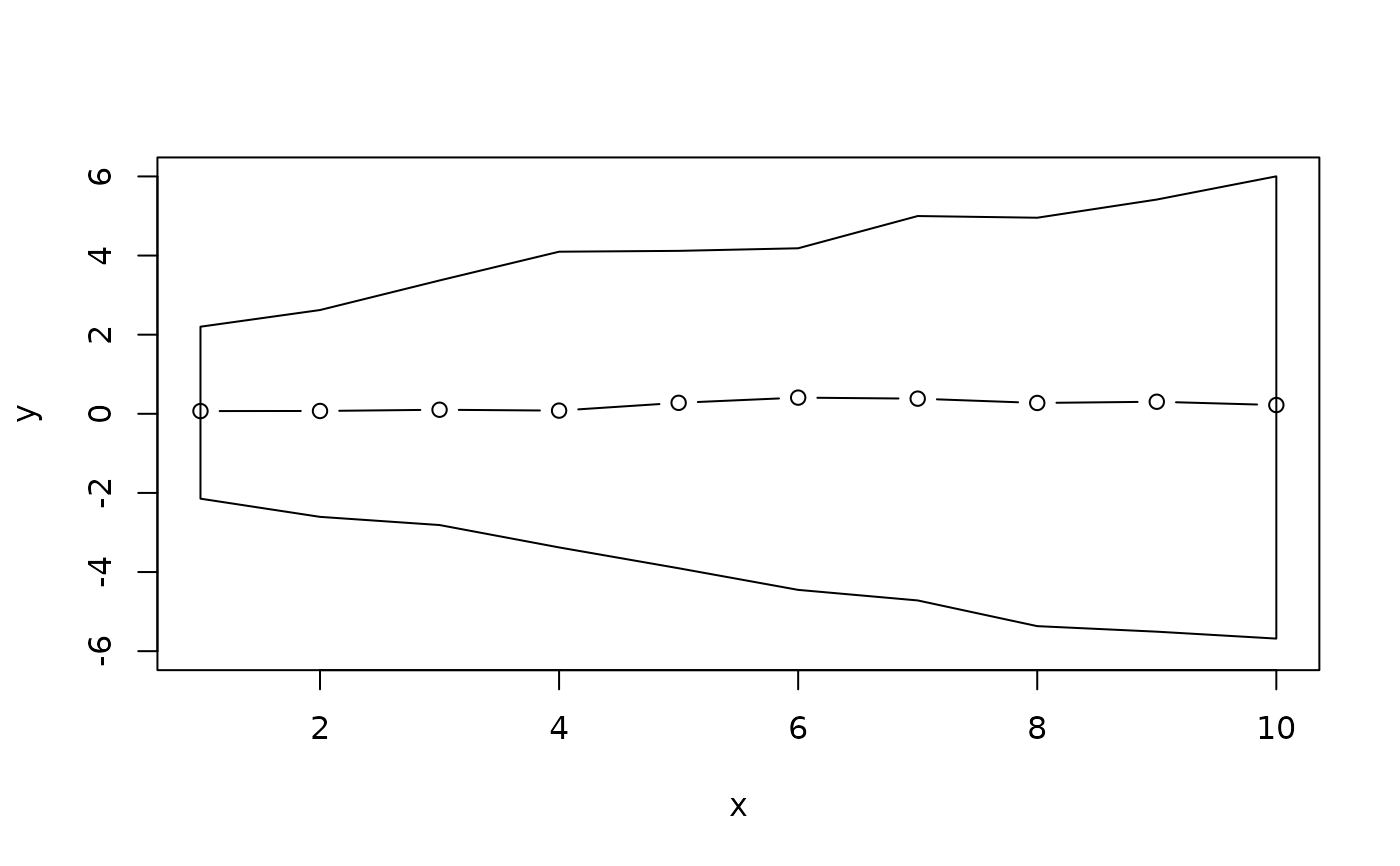
This function computes the area for confidence intervals of time-series
data, which can be used for visualizing uncertainty in time-series plots.
It takes a numeric vector x, a grouping vector group that indicates
which time point each value in x corresponds to, and an alpha level for
the confidence interval. The function returns a list containing two data
frames: one for the area of the confidence interval (suitable for polygon
plotting) and one for the median line of the time-series.
Usage
compute_ts_ci_area(x, group, alpha = 0.05)
Arguments
- x
Numeric vector.
- group
Grouping vector of the same length as x.
- alpha
Numeric scalar. Size of the two-sided interval tail.
Value
A list with two data frames: area (for polygons) and line
(for the median time-series).
Examples
# Simulating random walks
set.seed(123)
dat <- lapply(1:200, \(i) {
 data.frame(
   x = cumsum(rnorm(10)),
   time = 1:10
 )
}) |> do.call(what = "rbind")
ans <- compute_ts_ci_area(dat$x, dat$time)
plot(ans$line, type = "b", ylim = c(-6,6))
polygon(x = ans$area$x, y = ans$area$y)